Home > Innovation > Arbin DCIM Feature

Arbin DCIM Feature

The Arbin DCIM feature is a state-of-the-art technology to measure battery impedance via a DC method. This is a practical substitute of ACIM measurement method to get EIS plot while also providing additional benefits.

Background

There are two methods to analyze a battery's impedance among a frequency range, AC method and DC method.

The AC method, also known as ACIM, applies a set of AC signals with different frequencies to the battery, meanwhile samples both AC current and voltage on the battery. Then the impedance can be derived from voltage/current amplitude and their phase shift at different frequencies.

The DC method, namely DCIM, applies a DC current to the battery, meanwhile sample the current and voltage on the battery. Then the impedance can be derived from fitting value to the battery's equivalent circuit.

Impedence Methods in Graphs

ARBIN-Impedence Methods in Graphs

Arbin's DCIM Feature Benefits

Arbin provides a built-in universal DCIM feature utilizing DC method allowing the user to measure battery's impedance easily.

Arbin's DCIM feature focuses on mid-range frequency, does not require additional AC equipment and takes less than 1s test time without disturbing regular battery test.

On the contrary, the traditional AC method focuses on a wider frequency range but requires additional AC equipment and a much longer measurement time.

Below is the comparison of AC method and DC method for Battery Impedance measurement:

AC Method
Arbin DC Method
Testing Time
5~1h
<1s
Hardware Requirement
Additional AC source and measurement Equipment required
Built-in Arbin Channel, no additional hardware needed.
Applied Signal to Batter
Sinusoidal current/Voltage wave at different frequency
Constant DC current
Disturb Battery Test
Disturb regular battery test
Does not distrub regular battery test
Frequency Range
1mHz~1MHz
1Hz~1kHz

ACIM vs DCIM

The DCIM method can generate similar EIS(nyquist) plot compared to the one from traditional ACIM method as seen in Diagram 6, with corresponding fitting model parameters shown in Table 1. Thus, it can be a practical substitute for the traditional ACIM method.

The test used to create the plot points outlined in the graph and table below was performed on a 18650 cell at .05 C source current.

In the Graph:
The black curve is the measured EIS(Nyquist) plot via ACIM method The blue curve is the fitted EIS curve based on measured ACIM method data and battery equivalent circuit.
The yellow curve is the fitted EIS curve based on measured DC method data and battery equivalent circuit.

ARBIN-ACIM vs DCIM
R0
R1
C1
R2
C2
DCIM Fitting
0.02795
0.0091541
4.20221
0.006298
0.24452
ACIM Fitting
0.02741
0.00943
3.1126
0.00677
0.1135

Table 1: Derived parameters using a 18650 cell

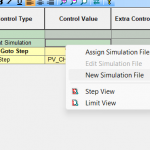
How to run DCIM on MITS 11

1. Create new Test Plan, choose schedule "[Built-in] DCIM"

ARBIN-Create new Test Plan

2. Start the test plan, wait until it finished

ARBIN-Start the test plan, wait until it finished

3. Go to test summary page of that test plan, press advanced, then press DCIM mode to the result when run DCIM calculation with the default parameters

ARBIN-Go to test summary page of that test plan

4. Update the parameters in Initial Guess sections and press calculate to manually calculate the DCIM

Scroll to Top